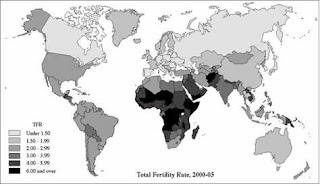
Unstandardized Choropleth Map
Unstandardized choropleth maps use data with raw sets of numbers. These raw numbers represent the total value and are not averaged together. This example is a representation of total fertility rates from 2000-2005 in the nation. The legend explains that the lighter shaded continents have lower fertility rates than the darker shaded continents.

No comments:
Post a Comment