Histogram
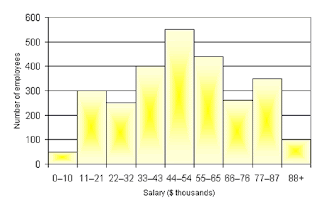
Histograms are used to display the distribution of data and the probability of a continuous variable. They also predict the density of the data, with the total area always equaling 1. Consistent intervals are marked on both the x- and y- axis, which shows equal frequencies of observations. This example is showing the relative number of employees a business has and the salary that each employee (on average) makes. It predicts that those working in companies with 500+ people, are only making half the salary as those with 10 or fewer, or 88 and more employees.

No comments:
Post a Comment