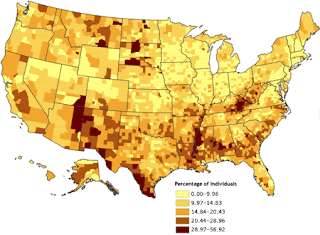
Univariate Choropleth Map
A univariate choropleth map only displays one set of variables or data. Again, different shades of colors are used to represent the difference between each category. This example represents the percentage of individuals living in poverty in 2000, classified by county.

No comments:
Post a Comment