Sunday, April 24, 2011

Stem and Leaf plot

Steam and Leaf plot

A stem and leaf plot is a graphical way to display statistics and gives the reader a quick representation of the distribution, shape and density of the data. In statical terms, the mode and outliers are easily identified by just looking at the chart. Stem and leaf plots, like the one above, uses the first significant digit as the "stem", divided by a line, and the second significant digit as the "leaf." Each stem is only listen once, but a leaf digit could be repeated if a number is duplicated. 

Box plot

Box plot
A box plot graphs numerical data through 5-number summaries; the smallest observation, lower quartile (Q1), median (Q2), upper quartile (Q3), and largest observation. The three quartiles are marked with a box, and the smallest and largest observations and marked with the end points of the line. The spacings between each box can differ depending on the degree of dispersion and skewness of the data. 

Histogram

Histogram
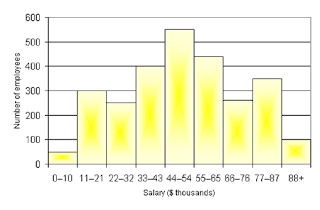
Histograms are used to display the distribution of data and the probability of a continuous variable. They also predict the density of the data, with the total area always equaling 1. Consistent intervals are marked on both the x- and y- axis, which shows equal frequencies of observations. This example is showing the relative number of employees a business has and the salary that each employee (on average) makes. It predicts that those working in companies with 500+ people, are only making half the salary as those with 10 or fewer, or 88 and more employees.

Parallel Coordinate Graph

Parallel Coordinate Graph
Parallel coordinate graphs are used analyze multivariate data and the geometry of multidimensional problems that are not satisfied by our 3D perceptions. It displays a group of lines containing a set of points separated by equally spaced vertical lines. This is an example from Alfred Inselberg, who invited the parallel coordinate who says this coordinate system can be applied to air traffic control, visual data mining, and interactive models of other complex systems.

Triangular Plot

Triangular Plot
Triangular plot, also known as a ternary plot, depicts the ratios of 3 variables which sums to a constant (1.0) that is positioned in an equilateral triangle. A lot of times it is used in physical sciences to show the relations between species and substances. The example above shows the data plotted in 3 bivariate cross-plots (AB, BC, AC) which translates onto the triangular diagram, where means and standard deviations are calculated. 

Windrose

Windrose
The windrose is used by meteorologist when graphing weather conditions and the wind speed and direction at a specific location. The different colored bands represent the wind ranges. The direction of the winds with the longest band shows the wind direction with the greatest frequency. Typically windroses will use 16 bands, each representing a different cardinal directions- but can be subdivided into as many as 32 directions. A practical application is the importance of a windrose when construction an airport runway, as wind speed and direction effects airplanes take-offs and landings. 

Climograph

Climograph
Climographs are used to show climatic temperatures and precipitation of a certain area. This example of a climograph show the precipitation and temperature levels in Guam, graphed by month from January to December. Although there was a lot of variation in the precipitation levels, the temperature stayed relatively stable.